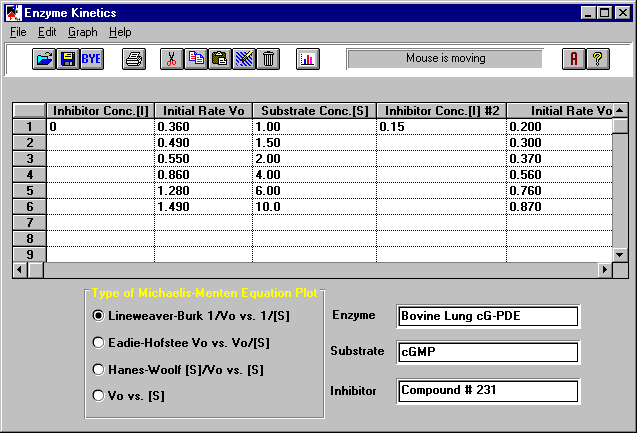
This program is a useful tool for anyone involved in studying enzyme kinetics. This
program calculates the Michaelis constant Km, the limiting velocity Vmax, and the
inhibition constant Ki for the rate of catalysis by enzymes. These calculations are based
on the Michaelis-Menton equation. Just enter the inhibition concentration [I], the initial
velocities Vo, and the substrate concentrations [S] for each reaction. Select the type of
plot you want (e.g., Lineweaver-Burk), and the program will calculate the Michaelis
constants Km and limiting velocities Vmax for you. From the graph of the Lineweaver-Burk
plot, you can determine the type of inhibition in your experiment. This information is
used to select the appropriate type of plot needed to calculate the inhibition constant
Ki. This program will increase your productivity by performing those tedious enzyme
kinetics calculations.
This software is designed as an efficient laboratory tool for the following:
The rate of velocity of catalysis by enzymes varies with the substrate concentration. The velocity increases with the increase in substrate concentration up to a certain point which approaches a maximum velocity Vmax. The Michaelis Constant is the substrate concentration at which the velocity is at half the maximum velocity. The Michaelis Constant is an indication of the affinity of the enzyme for the substrate. The lower the Km, the higher is the affinity. Michaelis-Menton Equation: Vo=(Vmax * [S])/ (Km + [S]). Just enter the inhibition concentration [I], the initial velocities Vo, and the substrate concentrations [S] for each reaction. Select the type of plot (e.g., Lineweaver-Burk). The results for the Michaelis constants Km, the limiting velocities Vmax, the slopes, and the Y-Intercepts will be displayed or you can display the graph.
INHIBITION CONSTANT
The inhibition constant Ki is the dissociation for the enzyme-inhibitor combination.
If you already know the Michaelis constants and limiting velocities, then enter the
inhibition concentrations [I], Michaelis constants Km, and limiting velocities Vmax.
Select the type of plot used in the calculation (e.g., Km). The result for the inhibition
constant Ki will be displayed or you can display the graph.
LINEWEAVER-BURK PLOT
The Lineweaver-Burk plot is one way of visualizing the effect of inhibitors and
determining the Michaelis Constant Km and the Limiting Velocity Vmax from a set of
measurements of velocity at different substrate concentrations. If 1/Vo is plotted against
1/[S], a straight line is obtained where the slope is equal to Km/Vmax and the y-intercept
is equal to -1/Vmax. This method is usually used for distinguishing the type of
inhibition. This information is used to select the appropriate type of plot needed to
calculate the inhibition constant Ki. If the Lineweaver-Burk plots of several inhibitor
concentrations intersect on the vertical axis, then you have a competitive inhibitor and
should select the Km type of plot. Competitive inhibitors have the affect of increasing
the Km of the reaction and therefore reduces the affinity of the enzyme for its substrate.
If the Lineweaver-Burk plots of several inhibitor concentrations intersect on the base
line, then you have a non-competitive inhibitor and should select the 1/Vmax type of plot.
Non-competitive inhibitors do not affect the combination of the substrate with the enzyme,
but it does affect the velocity. If the Lineweaver-Burk plots of several inhibitor
concentrations are parallel, then you have an uncompetitive inhibitor and should select
the 1/Km type of plot. Uncompetitive inhibitors have the affect of decreasing the Km and
the velocity of the reaction to the same extent. If the Lineweaver-Burk plots of several
inhibitor concentrations intersect above or below the 1/[S] axis, then you have a mixed
inhibitor and should select the 1/Km type of plot. Mixed inhibitors have the affect of
decreasing the velocity of the reaction and either increasing or decreasing the Km.
EADIE-HOFSTEE PLOT
The Eadie-Hofstee plot is another way of visualizing the effect of inhibitors and
determining the Michaelis Constant Km and the Limiting Velocity Vmax from a set of
measurements of velocity at different substrate concentrations. If Vo is plotted against
Vo/[S], a straight line is obtained where the slope is equal to -Km and the y-intercept is
equal to Vmax.
HANES-WOOLF PLOT
The Hanes-Woolf plot is another way of visualizing the effect of inhibitors and
determining the Michaelis Constant Km and the Limiting Velocity Vmax from a set of
measurements of velocity at different substrate concentrations. If [S]/Vo is plotted
against [S], a straight line is obtained where the slope is equal to 1/Vmax and the
y-intercept is equal to Km/Vmax.
Requires Windows 3.1, 3.11, 95, 98 or NT